This article provides couple of examples of performance tuning settings for K10
K10 uses helm parameters, which can be updated for K10 performance tuning. Default settings should suite most customers' needs. However, in complex environments K10 administrators might want to tune the execution control parameters to improve K10 performance and solve various execution issues related to system resource utilization. This guide will cover most frequent cases seen in complex environments.
Note: while tuning the system, it is important to rely on the metrics K10 exposes. For many performance related metrics, K10 offers graphs visible in the K10 bundled Grafana instance. Make sure that Grafana and Prometheus are enabled (they are enabled by default).
This article covers two different performance problems that can be seen with K10
Problem - 1 : K10 takes too much time to pick up an actionPossible cause
Not enough workers to pick up actions new actions due to existing K10 worker load.
Related Helm settings
-
services.executor.workerCount
-
executorReplicas
Possible solutions
-
It is possible to tune services.executor.workerCount to increase number of workers per executor instance
-
It is also possible to tune executorReplicas to increase the number of executor instances
Both approaches have their pros and cons. Increasing the number of workers per executor instance will not increase the resource consumption in the cluster, but at the same time may hit the limitations of the executor pod. Increasing the number of executor instances will on the opposite, consume more resources in the cluster, but will not hit the limit inside the executor pod.
Tuning impact analysis
To understand the impact of the changes, it is recommended to check in-built K10 Grafana Dashboard. Using Executor Worker Load graph, it is possible to observe the total number of workers (worker count multiplied by the number of executor instances) over the time and the worker load (how many workers are currently in use).
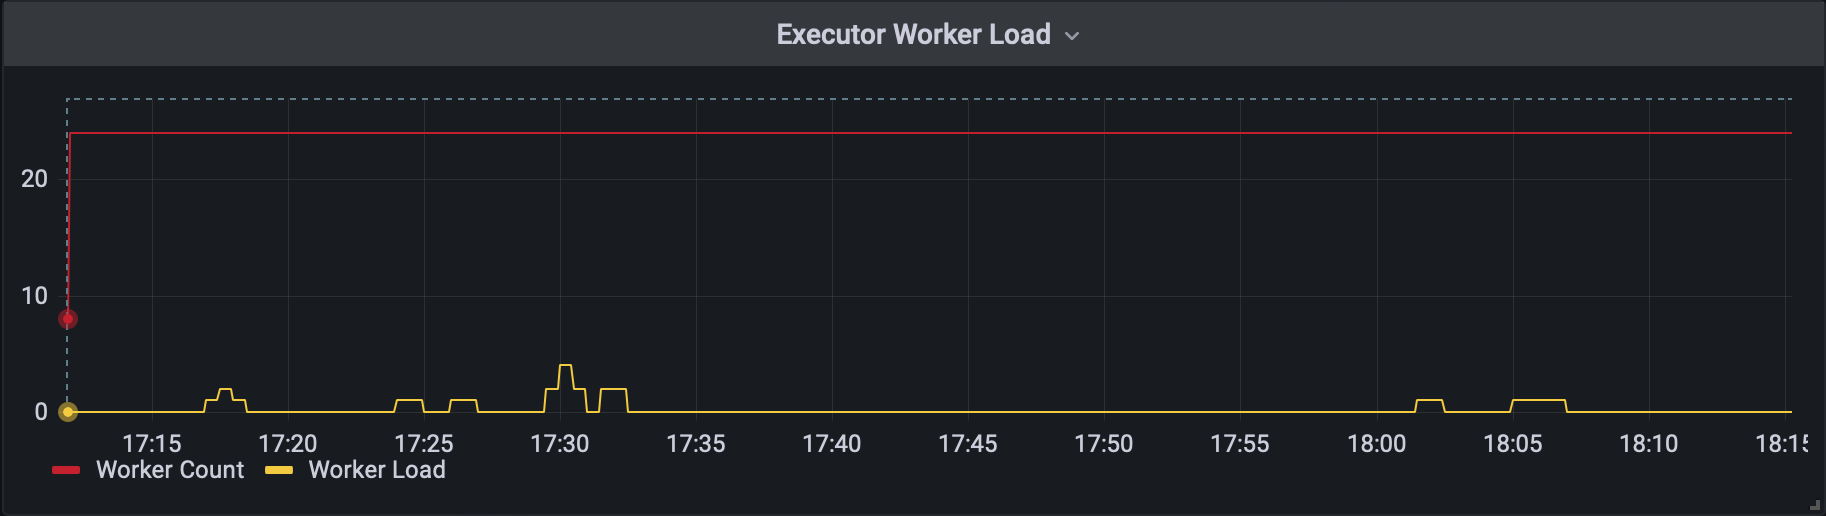
This graph shows that Worker Load never hits the worker count. In this case it is not recommended to change the settings.
Common pitfalls
-
Setting services.executor.workerCount and executorReplicas to the values below their default is not recommended and can have a negative impact on K10 performance.
-
Increasing services.executor.workerCount and executorReplicas to the values much higher than the average worker load may increase the resource consumption in the cluster without a real benefit.
-
Even if the task is being picked up by the Executor, it may hit the rate limiter limitations and the task will be paused until it will be allowed to run by the rate limiter, this is covered in the following section.
Problem-2 : K10 pick up an action, but execution takes long time
Possible cause
Rate Limit suspend actions due to too many same concurrent operations
Related Helm settings
-
limiter.genericVolumeSnapshots
-
limiter.genericVolumeCopies
-
limiter.genericVolumeRestores
-
limiter.csiSnapshots
-
limiter.providerSnapshots
Possible solutions
-
It is possible to tune above mentioned settings to increase rate limit limits.
-
Distribute the execution of operations over time to avoid running them simultaneously.
Tuning impact analysis
To understand if RateLimit limits operation, it is recommended to check in-built K10 Grafana Dashboard.
Execution Control | Rate Limiter - %operation%
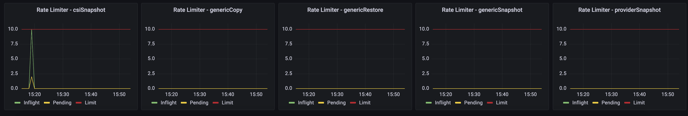
The growth of pending tasks indicates that the rate limiter is limiting tasks. Operations are in a pending state, waiting for their turn. So action is frozen.
Common pitfalls
Increasing rate limit values can lead to overloading cluster with high amount of heavy concurrent operations.
Additional useful graphs to troubleshooting performance issues:
Execution Control | Rate Limiter - avg operation duration
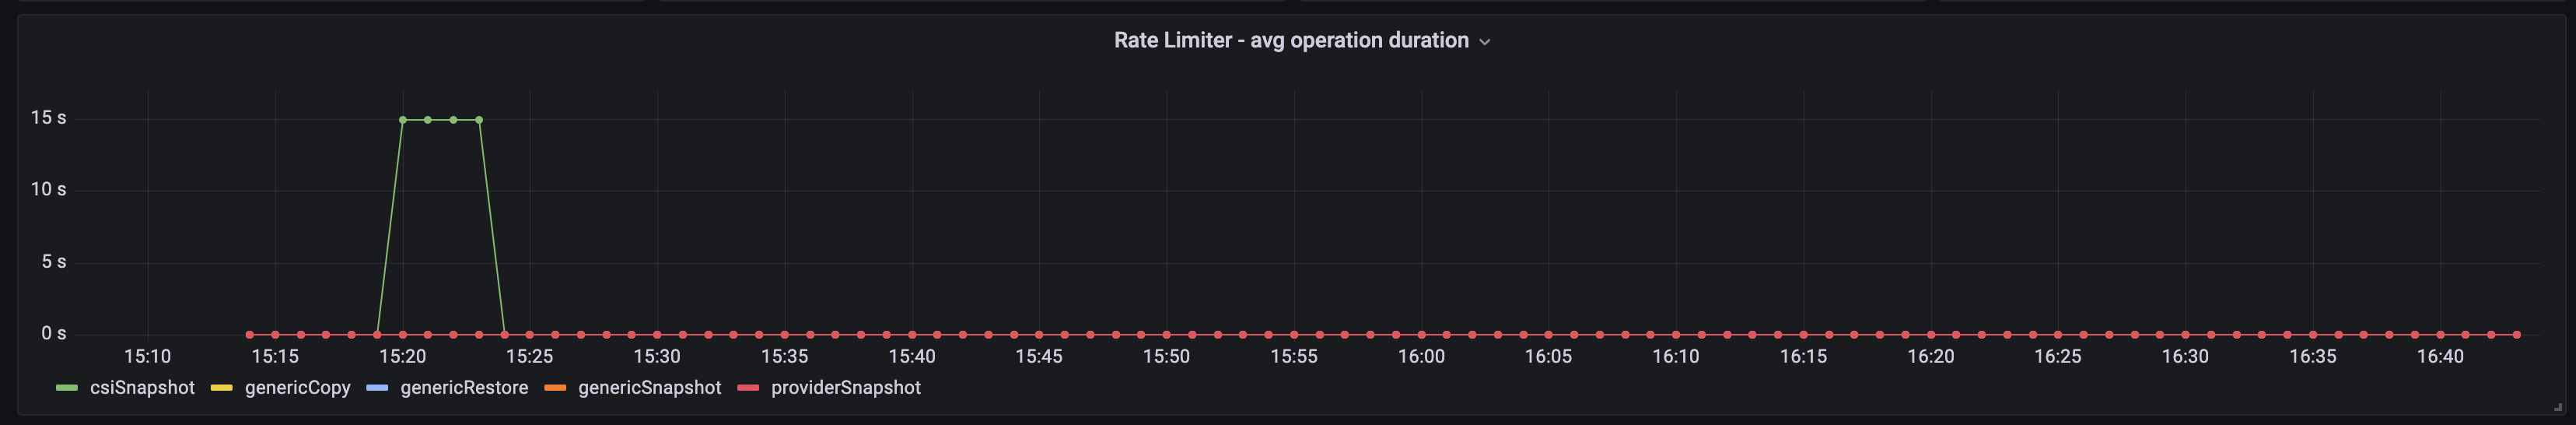
Can provide more information about rate limiter behavior. This can be useful over a long time period to track the trends.
Many pending tasks + low duration = many operations started
Many pending tasks + high duration = operations are in process for a long time
Execution Control | Average Action Duration
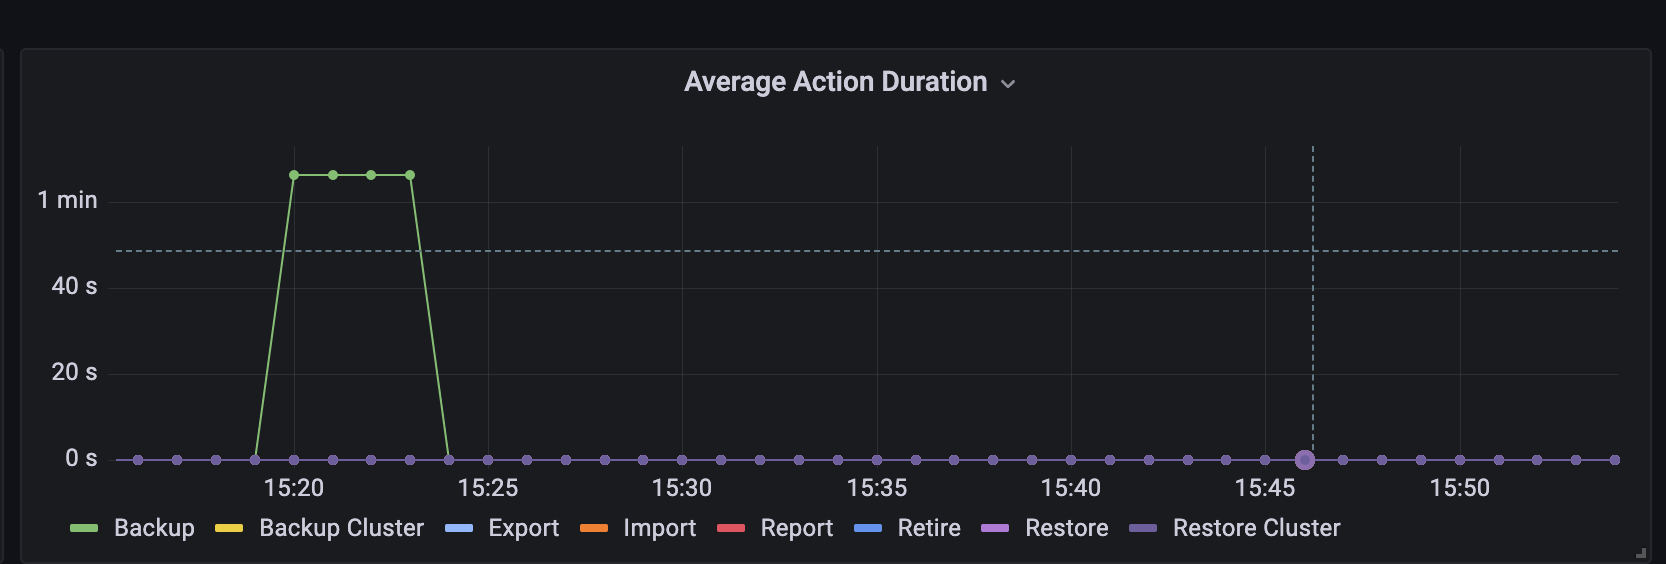
e.g.
- Average export duration dramatically increased on a certain day - possible network problems that day(?)
-
Average backup duration is noticeably increasing every day - possible user backup some unwanted data like logs data(?)
Execution Control | Finished %actions%
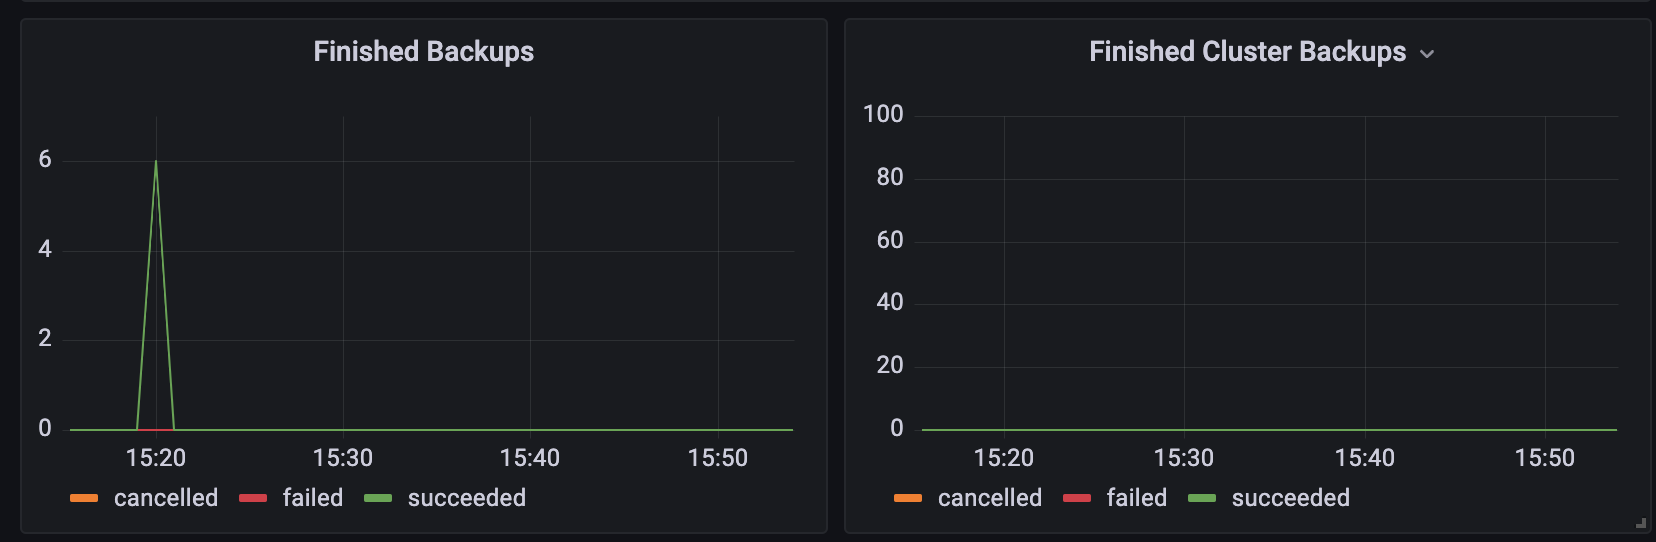
Displays finished actions by status on timeline.
Some examples of how it can be useful
-
Peaks of finished jobs + huge Average Action Duration value indicates, it is advisable to distribute the execution of operations over time to avoid running them simultaneously..
-
Failed actions can correlate with some infrastructure issues.
K10 System Resource Usage| Cpu total seconds per service/Memory consumption by service
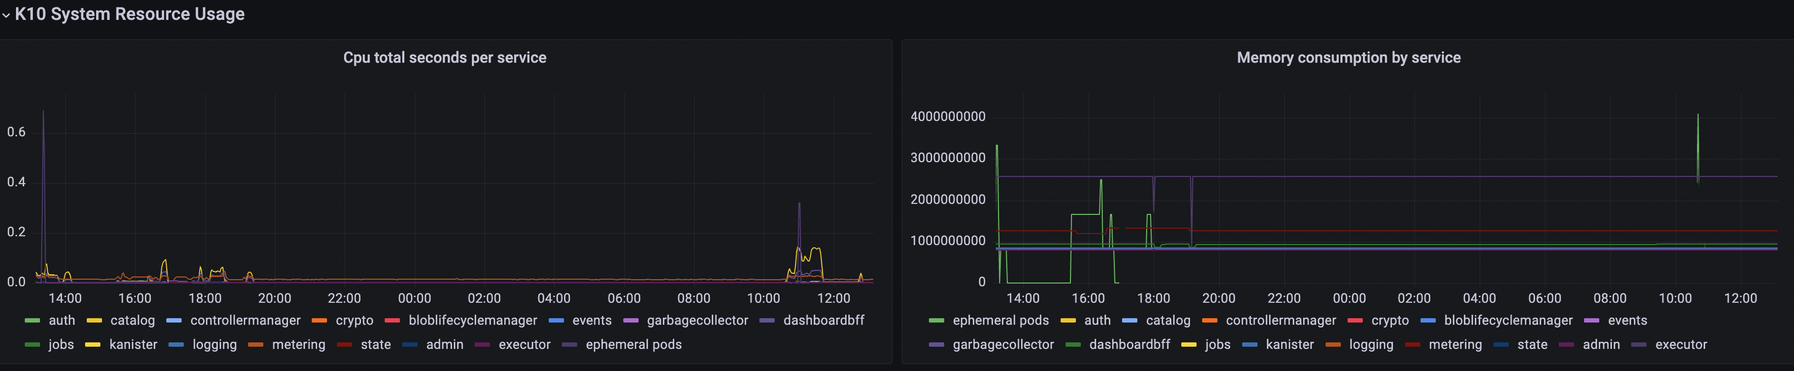
Understanding the dynamic utilization of resources can help investigate performance problems. By monitoring resource usage, insufficient resources availability for the cluster can be identified or suspicious resource usage after recent changes can be detected.
Additionally, analyzing resource usage per service can help fine-tune pod limits/requests. For example, if a system slows down due to a particular service working close to its limits, it may be necessary to increase the limits/requests for that service if there are enough resources available in the cluster.
Examples of such configurations include gateway.resources.[] and genericVolumeSnapshot.resources.[]