This article shows how to setup email alerts using Grafana instance of K10, which can help monitor failed/skipped jobs with K10
K10 provides an instance of Grafana that is deployed automatically on K10 installation and can be used to query metrics from K10's Prometheus instance. K10 also comes with a pre-created dashboard that helps visualize the status of K10's operations such as backup, restore, export, and import of applications.
More information about K10's Prometheus/Grafana can be found in our documentation https://docs.kasten.io/latest/operating/monitoring.html.
Enable SMTP in Grafana instance using K10’s helm chart
To enable the alerts to be sent by email, SMTP settings (Server, user, password), need to be provided to the Grafana instance. Below are the helm values, that must be used when installing/upgrading K10 to enable SMTP in grafana.
helm get values k10 --output yaml --namespace=kasten-io > k10_val.yaml && \
helm upgrade k10 kasten/k10 -f k10_val.yaml --namespace=kasten-io \
  --set grafana."grafana\.ini".smtp.enabled=true \
  --set grafana."grafana\.ini".smtp.host=<SMTP.SERVER.COM:PORT>\
  --set grafana."grafana\.ini".smtp.skip_verify=true \
  --set grafana."grafana\.ini".smtp.from_address=<EMAIL_TO_BE_USED_AS_SENDER> \
  --set grafana."grafana\.ini".smtp.from_name=<SENDER_NAME_FOR_THE_EMAIL> \
  --set grafana."grafana\.ini".smtp.user=<SMTP_USER> \
  --set grafana."grafana\.ini".smtp.password=<SMTP_PASSWORD>
Setting Alert rules, Contact points, and Notifications
Three additional settings need to be configured for enabling email notifications.
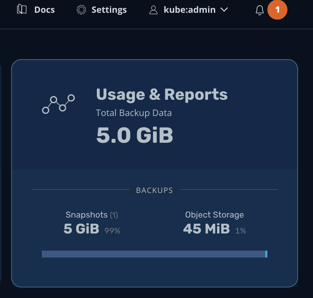
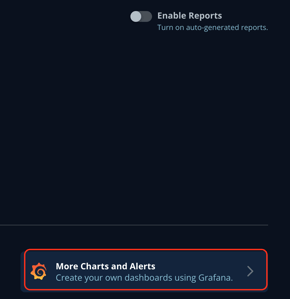
First is setting up Alert rules, which can be created from K10 Grafana's dashboard, to access please go to K10 dashboard > Usage & Reports > More charts & Alerts, or using directly the URL of the K10 dashboard, i.e.: http://K10.dashboard.url/K10/grafana/.
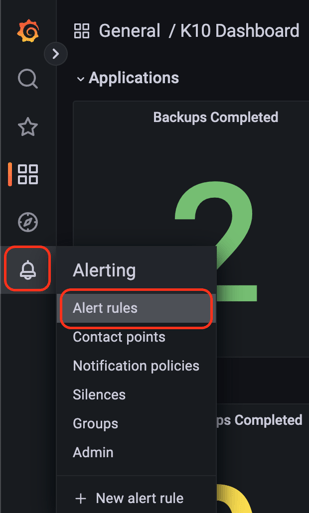
Using the left menu bar on K10 Grafana's dashboard, go over the bell icon and click on the "Alert rules" option:

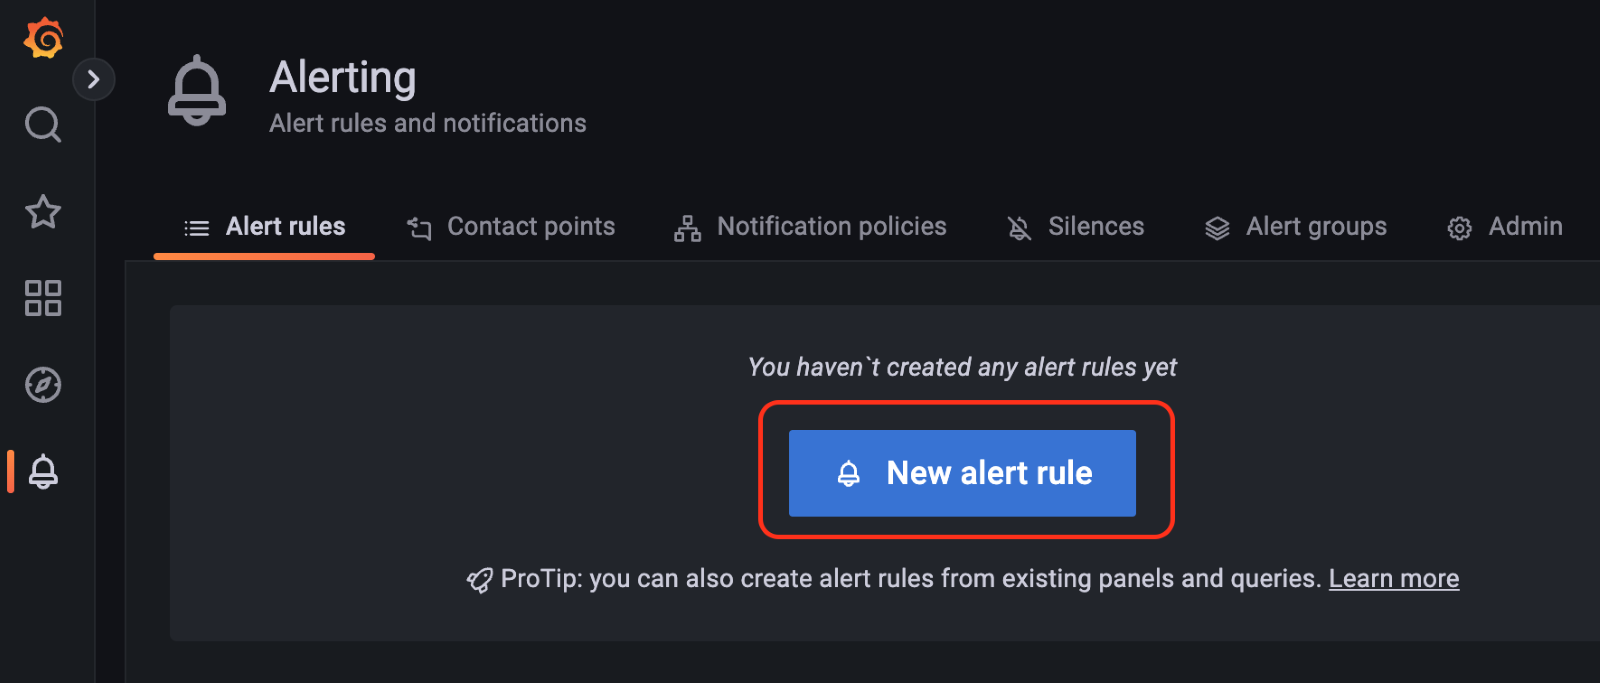
Next screen click on the "New alert rule" button:
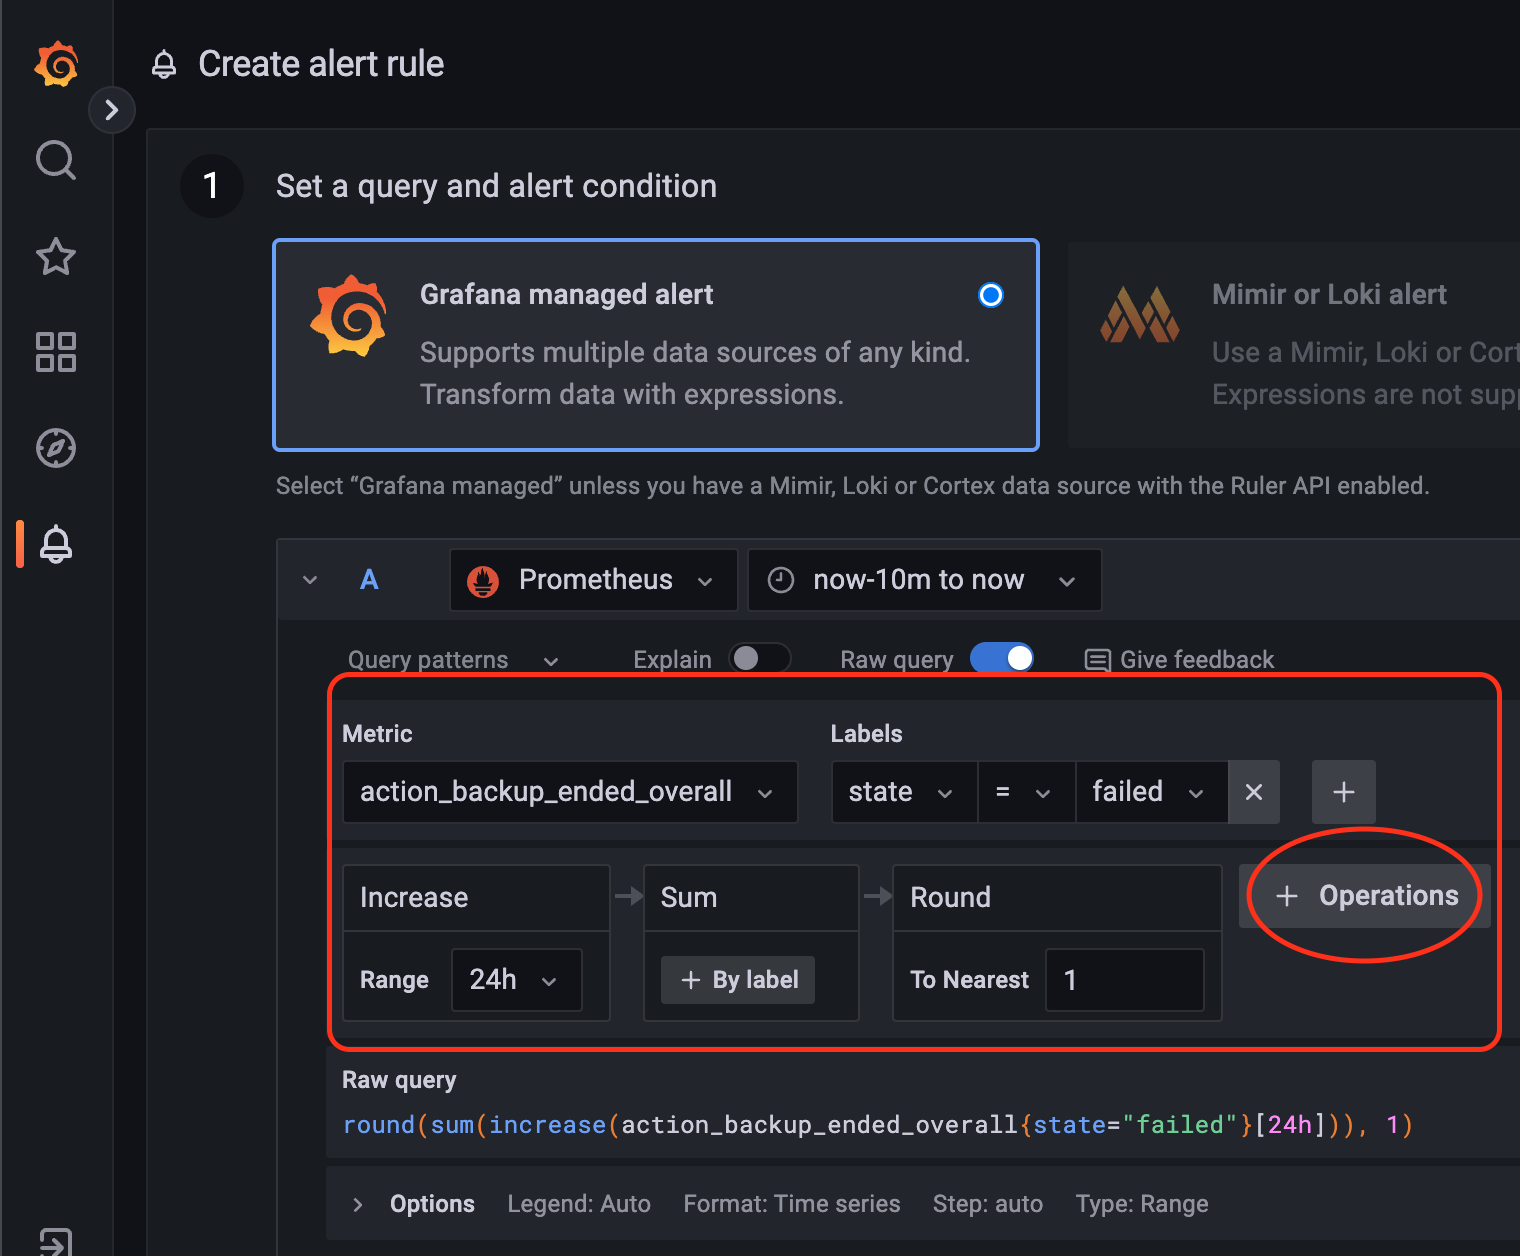
Keep the first option "Grafana managed alert", click on "Metric" and select the values below:
Metric: action_backup_ended_overall
Labels: state = failed
Click on the button "+ Operation" and add as below:
Range -> Function -> Increase and set the value to 24h
Aggregation -> Sum
Function -> Round
After finishing, the settings should look the same as in the screen below:
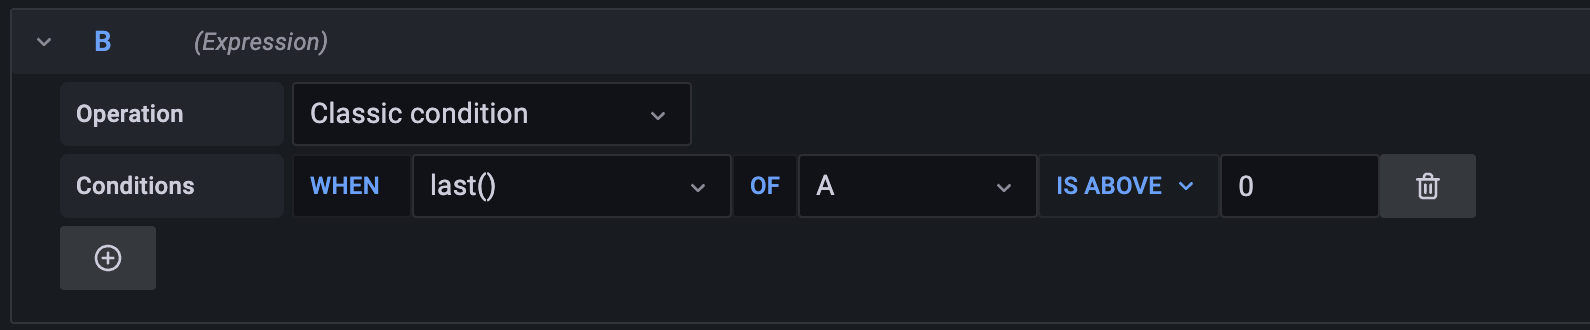
The next step is to setup the condition, in the example shown, an alert will be triggered when the query returns a value above "0":
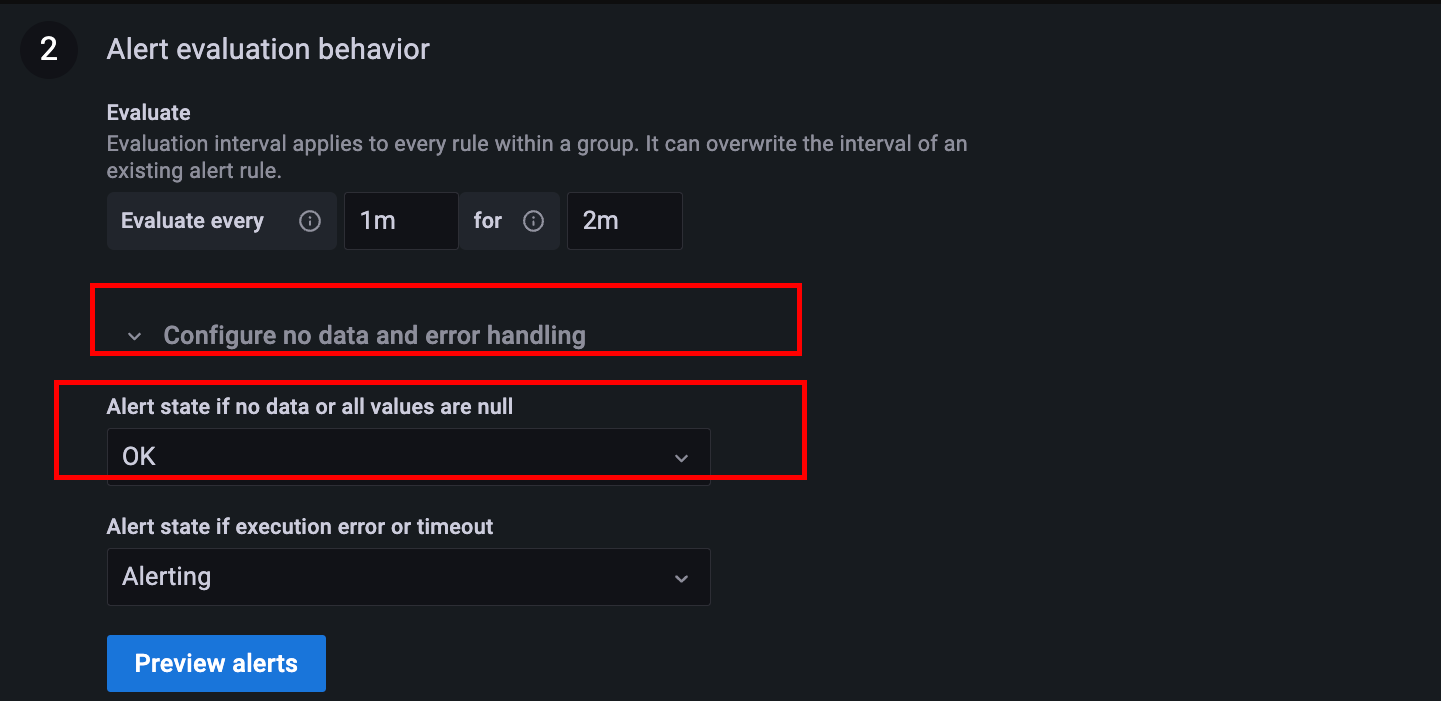
Next step is to setup the behaviour of alerting if the query returns empty response (which is expected when there are no operations initialized for some operations). This will ensure that there are no false alarms when the response of the query is empty.
Go to "Alert evaluation behavior" --> Configure no data and error handling --> Alert state if no data and error handling --> Set `Alert state if no data or all values or null` to OK
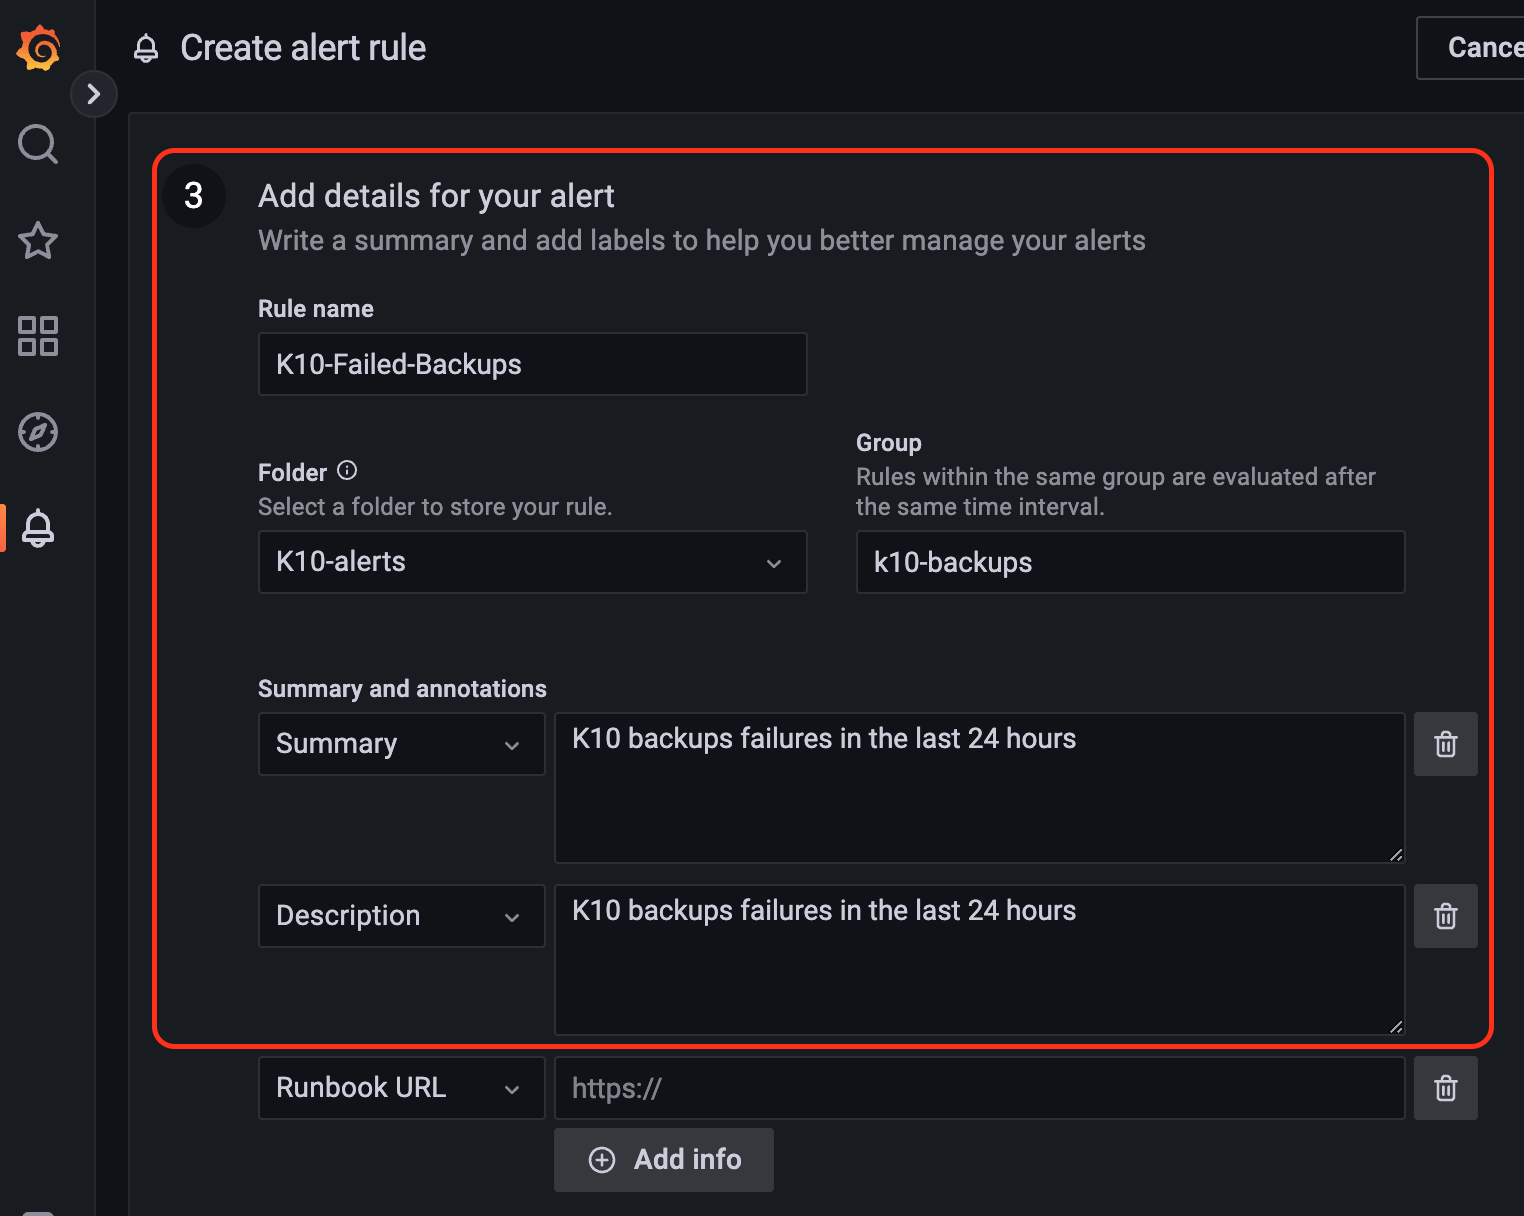
In this example, only basic information like rule name, folder name (will be automatically created), group, summary, and description are filled to keep it simple. Other fields can be configured to add more details to the alert like validation, runbook URL etc.
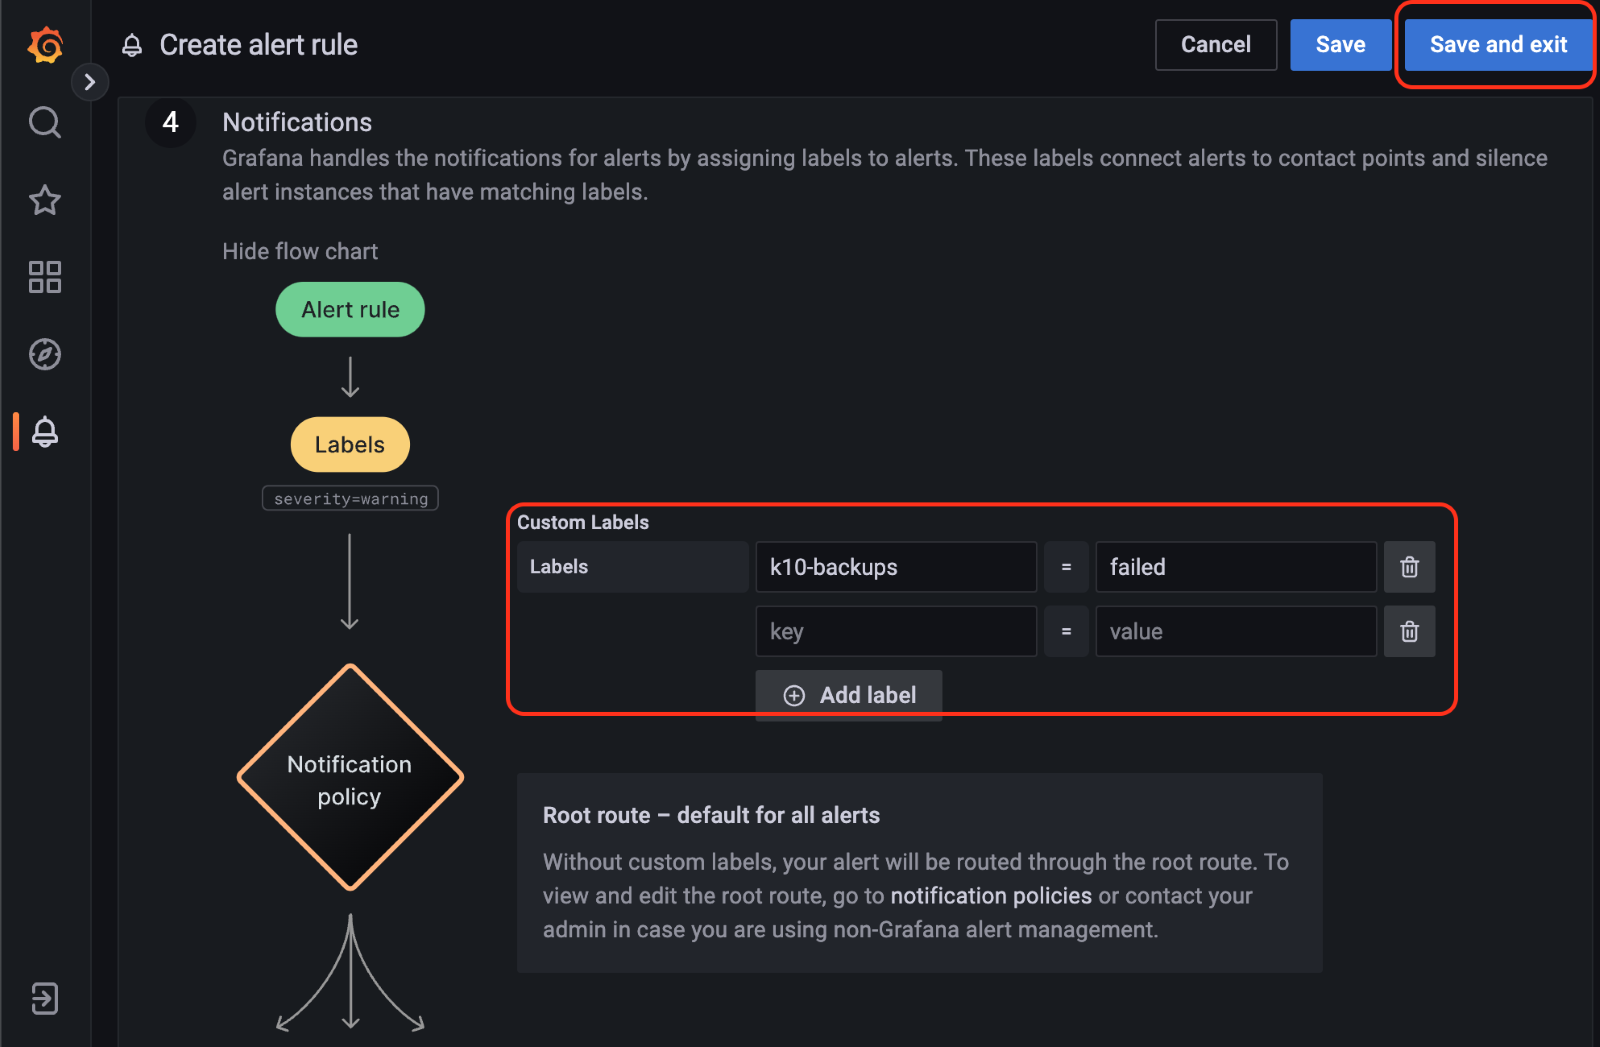
In the next step, add a label to be used in the notification, which can later be assigned to a contact point. In this example "K10-backups=failed" is used. After adding the label click Save and Exit in the top right corner of the screen:
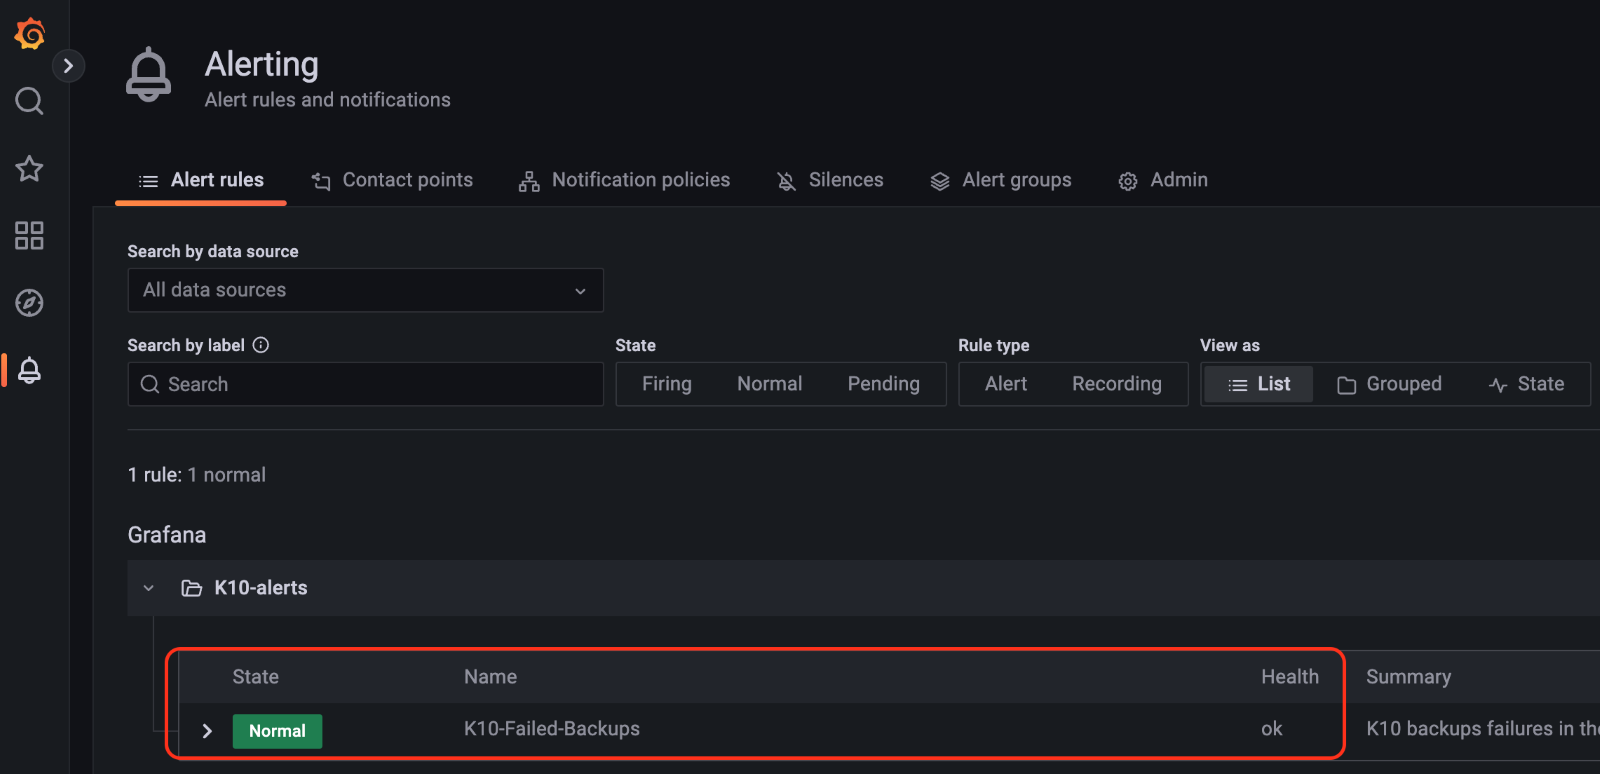
The alert created can be checked in the Alert rules screen:
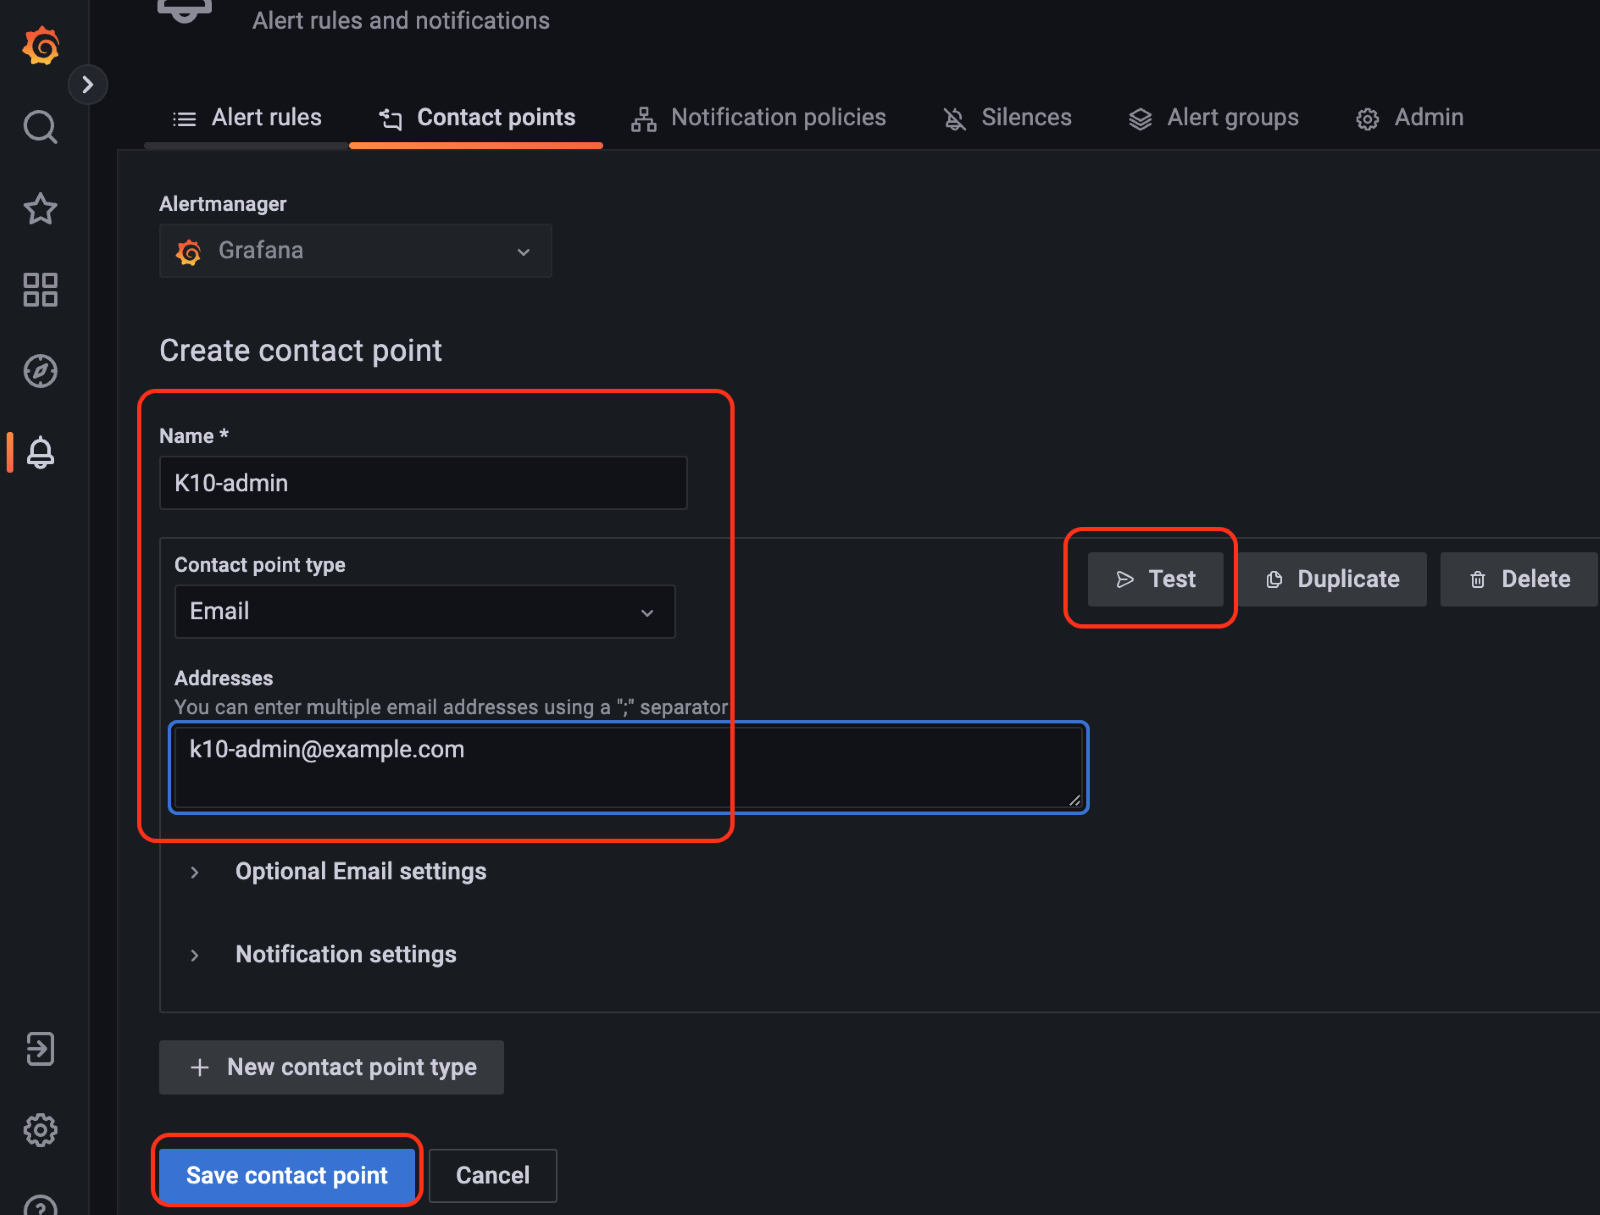
Next step is to setup the "Contact points". In the “Contact points” tab next to the Alert rules, click on the "+ New contact point" button, and add a name for the contact and email address.
Note – More than one email address can be used by adding ";" after each email id.
The email notification can be tested using the "Test" button that will send a notification to the emails listed in the "Addresses" field. After receiving the test email message from K10's Grafana, click on the "Save contact point" button:
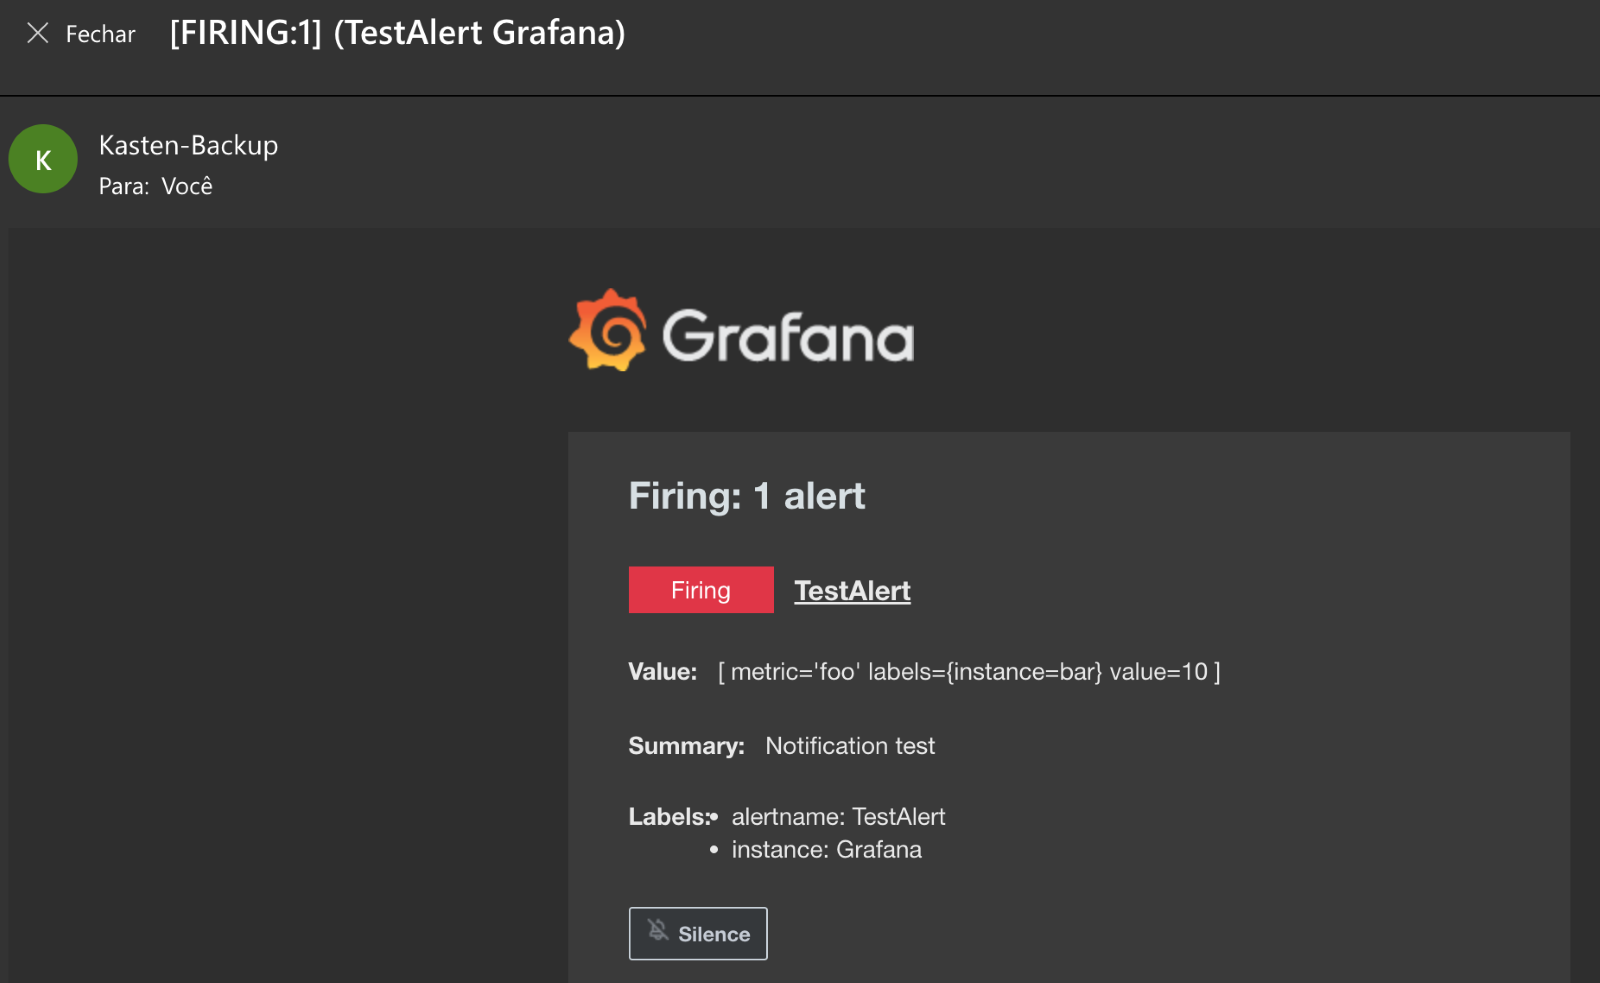
Test email sent by K10's Grafana:
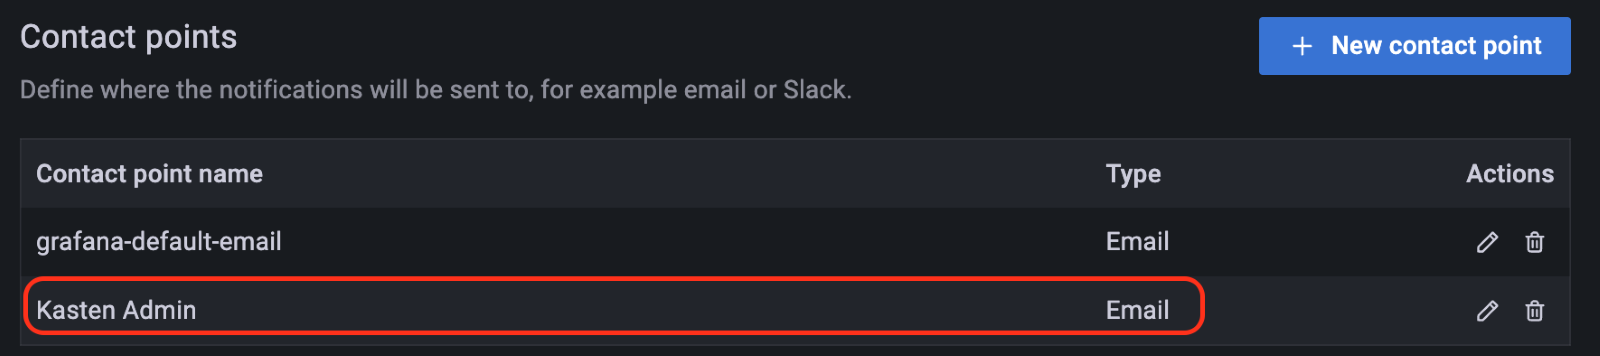
The contact is added in the contact points section:
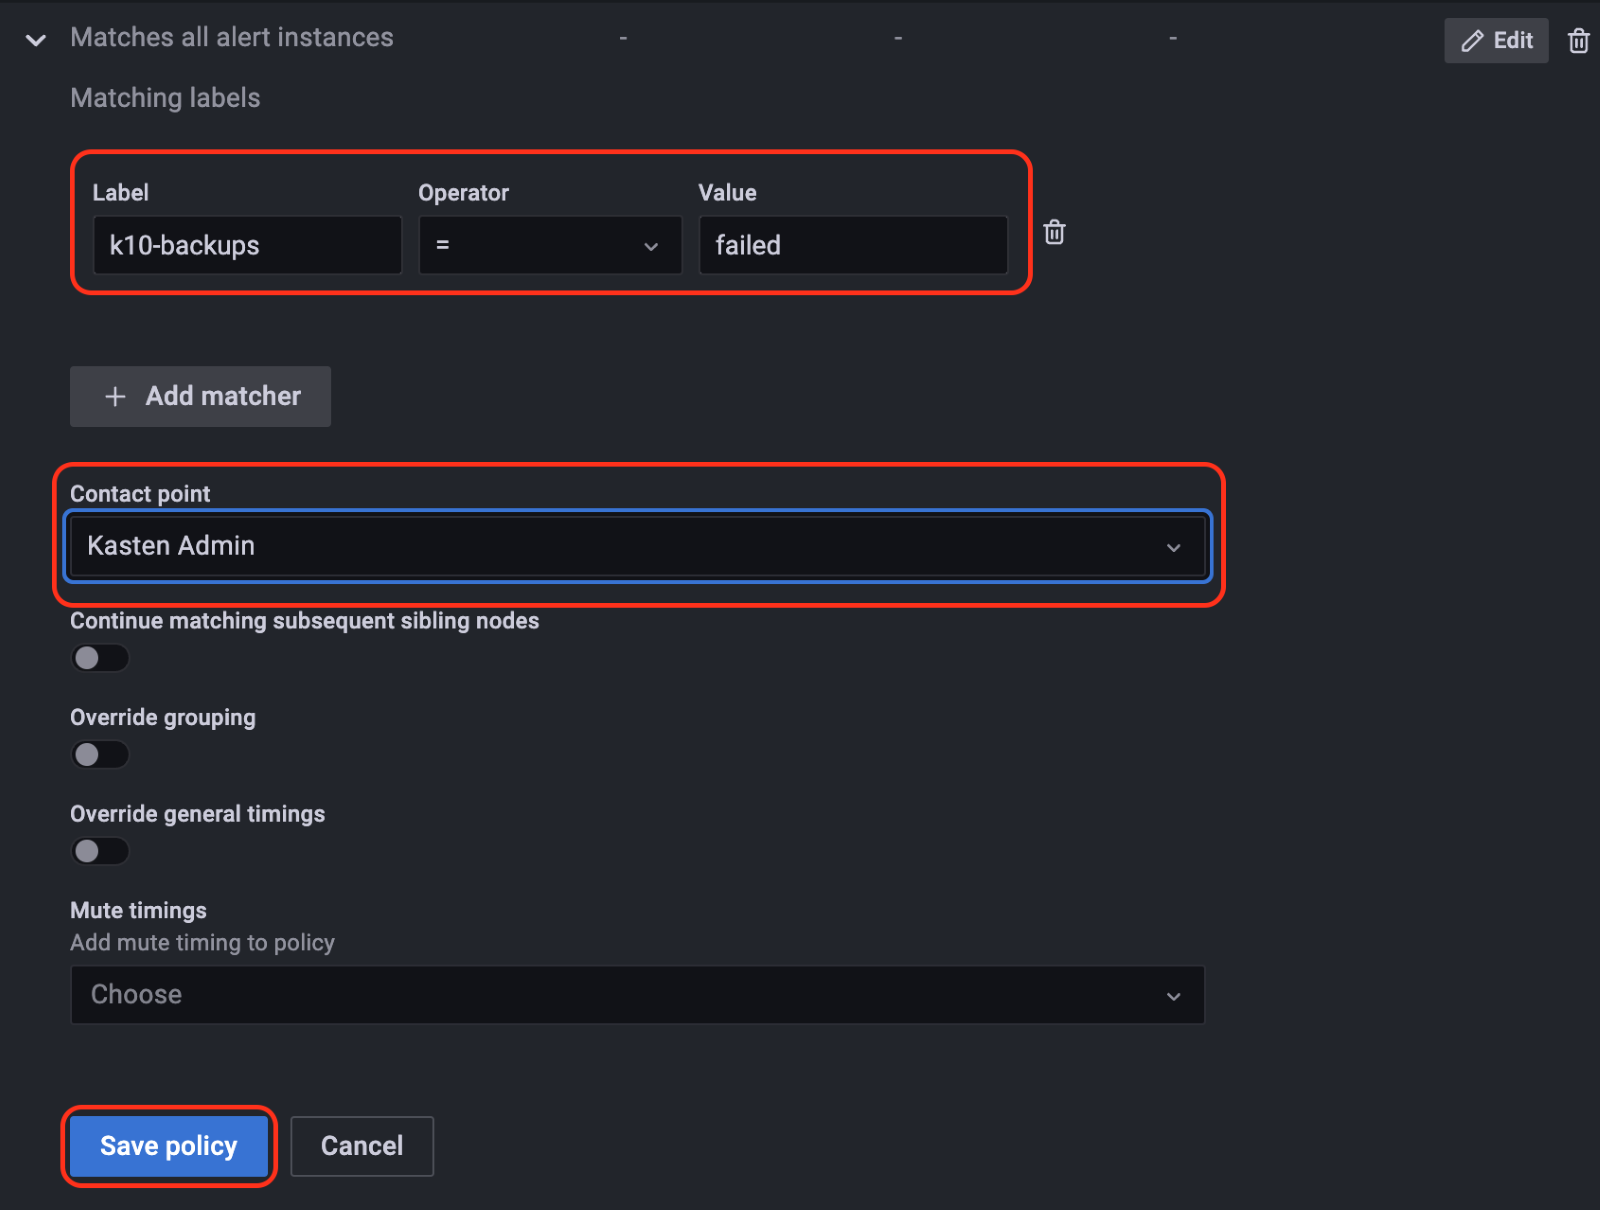
Alert rule and contact point are created. The next step is to define the notification policy. Go to next tab "Notification policies", and click on the "+ New policy" button to add the details. First one is the label; in this field the value has to be the same from the alert that was created earlier – for example the label "K10-backups=failed" was used. Then select the contact point that was just created in the previous step and click on "Save policy" :
Setup is complete now. As soon as the alert rule is triggered, i.e. has a number of failed backups over "0" in the last 24 hours, an alert will be sent by email.
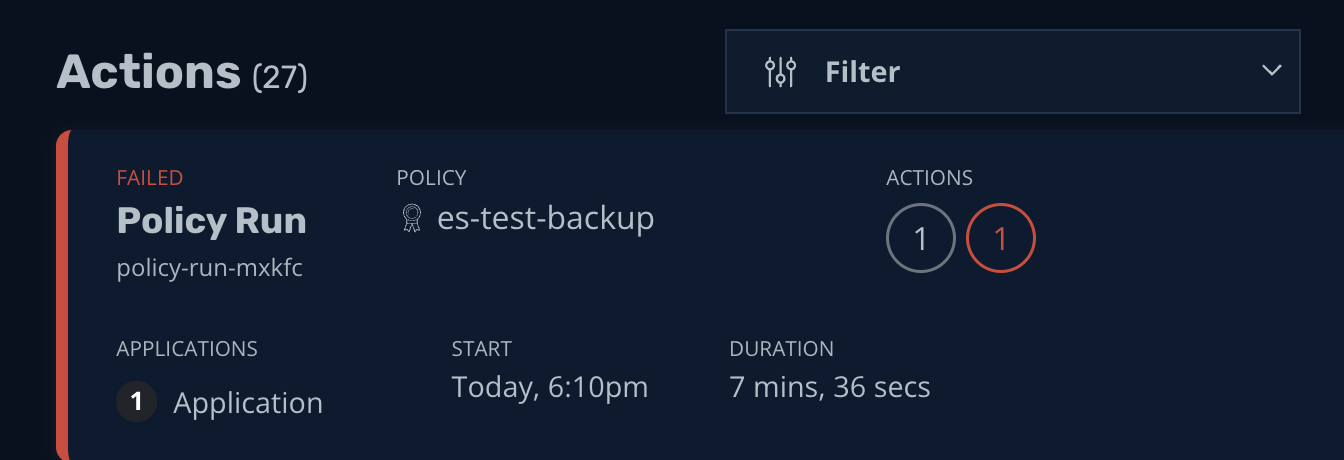
For testing, a policy failure was emulated:
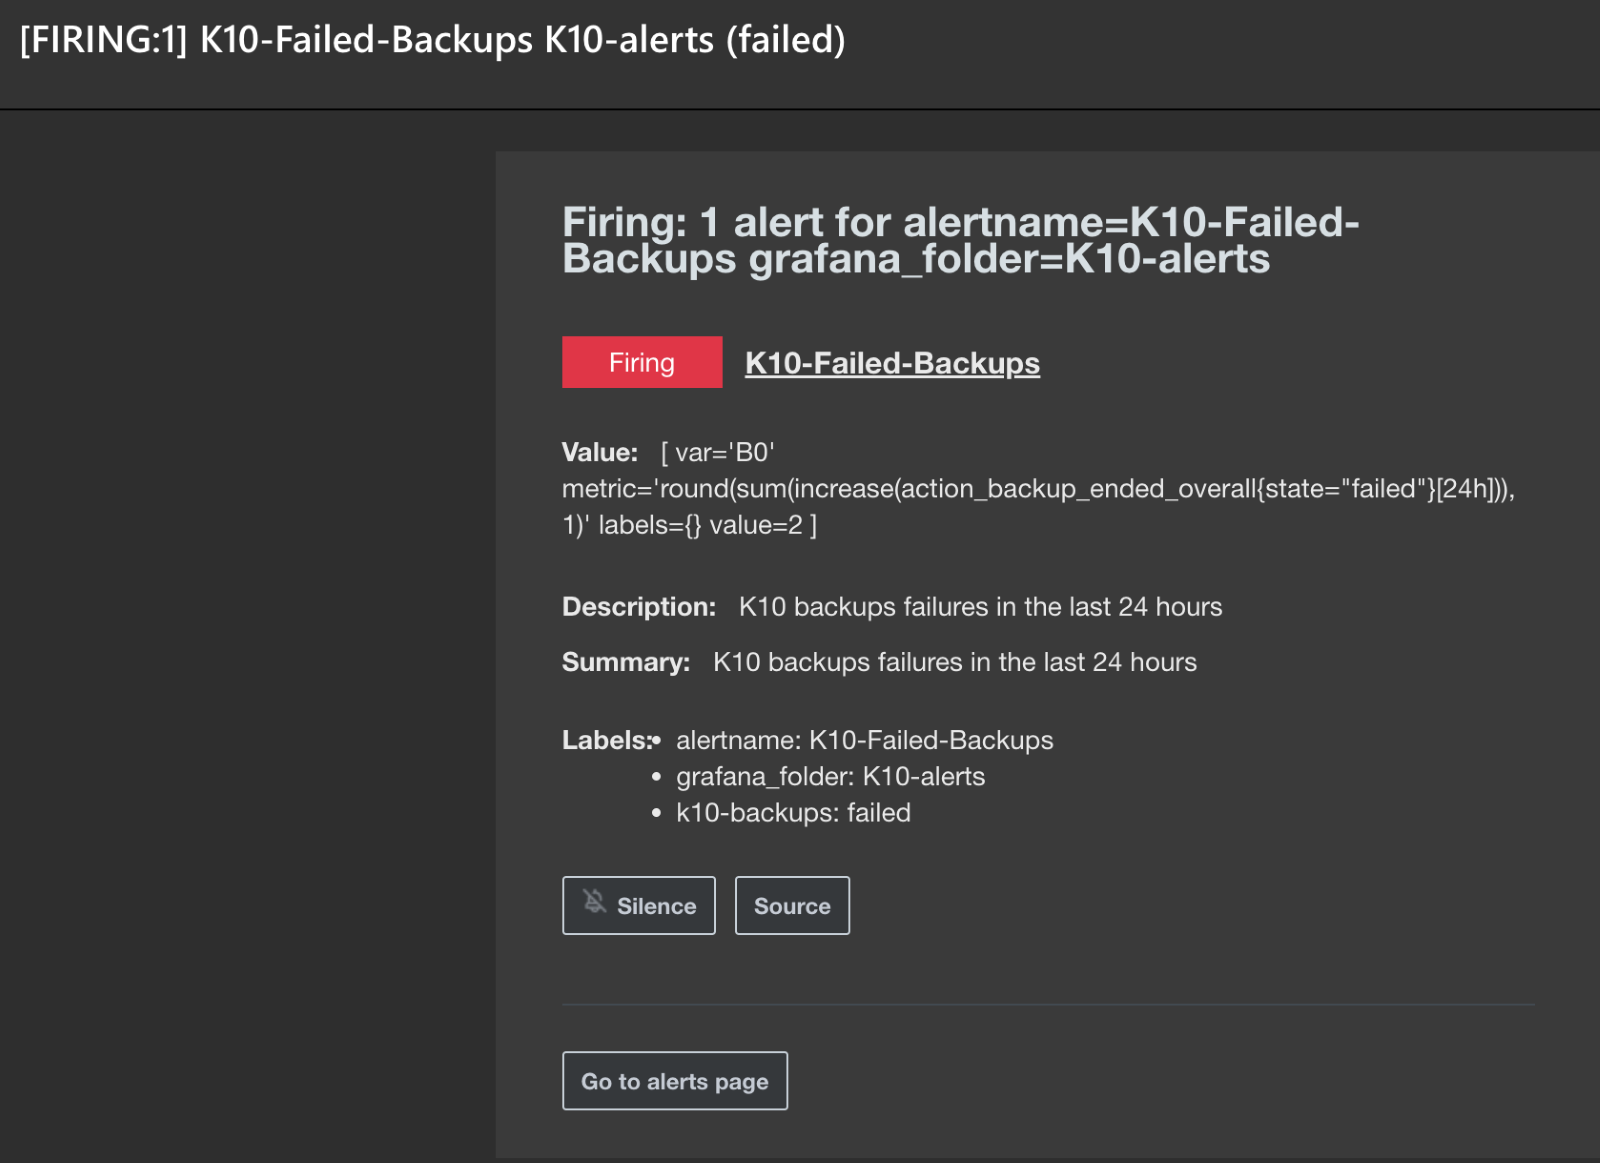
Alert was triggered on Grafana and email was sent to the contact point that was setup. The alert contains the metric used, labels, description and summary:
Conclusion
This is just an example to show how to use K10's Prometheus/Grafana for backup alerts. However, there are many other metrics and different notification methods(Integrating with Slack and more) that can be used. Please check out our documentation and also Prometheus/Grafana official docs to have more details about alerts/metrics.
https://docs.kasten.io/latest/operating/monitoring.html
https://prometheus.io/docs/prometheus/latest/querying/functions/
https://prometheus.io/docs/prometheus/latest/querying/basics/
https://grafana.com/docs/grafana/latest/alerting/